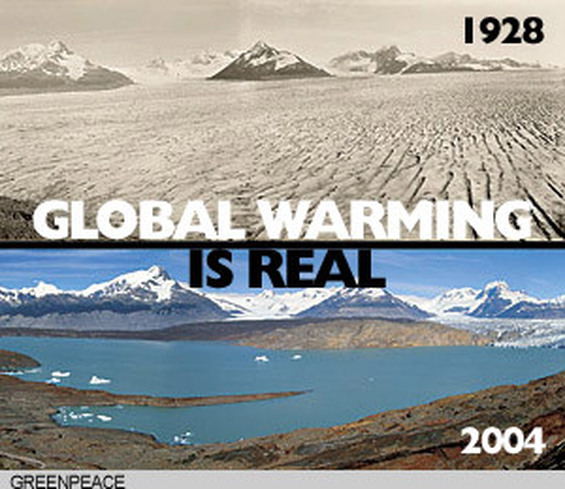
Global Warming
Not only is it real, it is accelerating, scientists say
New evidence shows changing speed of climate change
Global warming tied to risk of weather extremes
By MALCOLM RITTER - AP Science Writer
NEW YORK July 10, 2012 (AP)
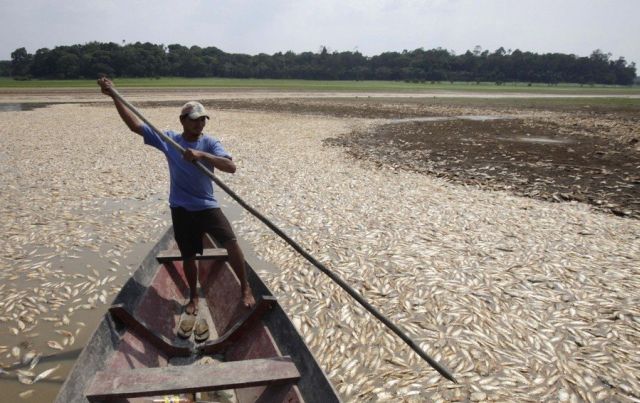
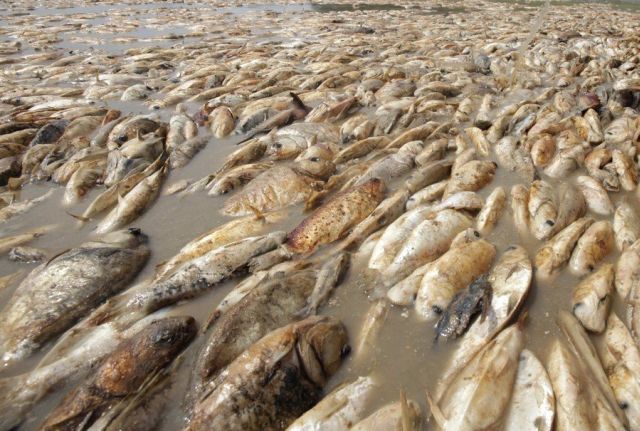
Last year brought a record heat wave to Texas, massive floods in Bangkok and an unusually warm November in England. How much has global warming boosted the chances of events like that?
Quite a lot in Texas and England, but apparently not at all in Bangkok, say new analyses released Tuesday.
Scientists can't blame any single weather event on global warming, but they can assess how climate change has altered the odds of such events happening, Tom Peterson of the National Oceanic and Atmospheric Administration told reporters in a briefing. He's an editor of a report that includes the analyses published by the Bulletin of the American Meteorological Society.
In the Texas analysis, researchers at Oregon State University and in England noted that the state suffered through record heat last year. It happened during a La Nina weather pattern, the flip side of El Nino. Caused by the cooling of the central Pacific Ocean, La Nina generally cools global temperatures but would be expected to make the southern United States warmer and drier than usual. But beyond that, the scientists wondered, would global warming affect the chances of such an event happening?
To find out, they studied computer climate simulations for La Nina years, focusing on Texas. They compared the outcome of three such years in the 1960s with that of 2008. They used 2008 because their deadline for the study didn't allow enough time to generate thousands of new simulations with fresh data from 2011. The two years were similar in having a La Nina and in amounts of greenhouse gases in the air.
The idea of the study, they said, was to check the likelihood of such a heat wave both before and after there was a lot of man-made climate change, which is primarily from burning fossil fuels like coal and oil.
Their conclusion: Global warming has made such a Texas heat wave about 20 times more likely to happen during a La Nina year.
Using a similar approach, scientists from Oxford University and the British government looked at temperatures in central England. Last November was the second warmest in that region in more than 300 years. And December 2010 was the second coldest in that time.
Their analysis concluded that global warming has made such a warm November about 62 times more likely, and such a cold December just half as likely.
Kevin Trenberth, of the National Center for Atmospheric Research's climate analysis section, said that he found the Britain study to be reasonable, given what he called a flawed climate model. As for the Texas result, he said that given how the study was done, the calculated increase in likelihood "could well be an underestimate."
A third analysis considered unusually severe river flooding last year in central and southern Thailand, including neighborhoods in Bangkok. It found no sign that climate change played a role in that event, noting that the amount of rainfall was not very unusual. The scale of the flooding was influenced more by factors like reservoir operation policies, researchers wrote.
Also at the briefing, NOAA released its report on the climate for 2011, which included several statistics similar to what it had announced earlier.
Last year was the coolest since 2008 in terms of global average temperature, which was about 57.9 degrees Fahrenheit (14.4 degrees Celsius.). But it still remained among the 15 warmest years since records began in the late 1800s, the agency said. It was also above average for the period 1980-2010.
See also: NOAA: http://www.climate.gov
Global warming facts
Basic facts are well-understood and accepted by the scientific community
Despite overwhelming scientific evidence, popular myths and misinformation abound.
Here are some of the facts of what we know about global warming.
Here are some of the facts of what we know about global warming.
1) Scientific consensus on global warming
Science community concurs warming is happening — and people are the cause
The most respected scientific bodies have stated unequivocally that global warming is occurring, and people are causing it by burning fossil fuels and cutting down forests.
This conclusion is shared by the national science academies of developed and developing countries (read the statement [PDF]), plus many other organizations, including the Intergovernmental Panel on Climate Change, which was established by the United Nations and the World Meteorological Organization to provide the world with "a clear scientific view" on climate change.
The only real debate is about how fast warming will occur, and how much damage will be done, as a result of human activities that produce heat-trapping CO2 and other greenhouse-gas emissions.
Climate scientists, like all scientists, are professional skeptics. They welcome — in fact, rely upon — rigorous challenges to their work from colleagues. Through this process of peer review and independent verification, scientists critique and double- (and triple- and quadruple-) check each others work.
This can lead to debate and controversy, but over time, solid research is validated, errors are discarded, and a body of reliable facts is created. In addition, science advances by focusing on what is not yet known. In the case of climate change, for example, there is an extremely good general understanding of the phenomenon, but many details are not yet understood. These gaps in the research, as they come to light, are systematically tackled by the scientific community.
In this context, the kind of material used by climate-change skeptics to cast doubt on global warming — whether it be a handful of emails stolen from an East Anglian research facility or a few errors in an IPCC report — are meaningless. The mountain of climate data assembled over decades by the scientific community as a whole is irrefutable. The records collected and analyzed by independent scientists from many disciplines and thousands of locations, paint a consistent, verifiable picture of a rapidly warming world.
Make no mistake: Science has given us unequivocal warning that global warming is real. The time to start working on solutions is now.
Source: Environmental Defense Fund
2) How we know the Earth is warming
Scientists are certain the Earth has been warming for 100 years. Here's how they know.
As far back as the 1850s, a small number of weather stations around the world were compiling temperature records. These numbers grew during the 20th century and today there are thousands of land-based weather stations and ocean buoys in every corner of the world monitoring temperatures.
Temperature records since 1850
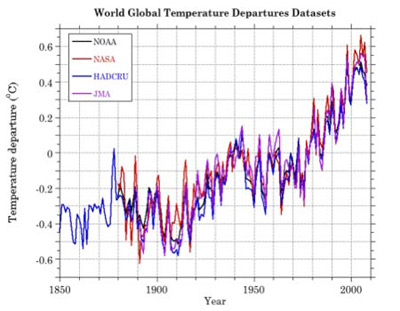
These temperature records clearly show a warming of the Earth over the past century, with particularly rapid heating over the past few decades.
Global temperature data
Each of the four agencies that report global temperature trends--NOAA, NASA, HADCRU, and JMA—show the warming trend.
View graph Source: NYT
Average U.S. temperatures
Annual average temperatures in the United States since 1880 also show the warming trend.
View graph. Source NASA
Satellite measurements since 1979
Atmospheric temperature measurements taken from orbiting satellites also show warming. Weather satellites have been monitoring global atmospheric temperatures since 1979.
Atmospheric temperatures
Trend in tropospheric temperatures (the lowest part of Earth's atmosphere) from 1979 to 2005 shows warming.
View graph Source: IPCC
Sea level rise in the 20th century
During the 20th century, sea level rose an average of 7 inches after 2,000 years of relatively little change.
Global sea level rise
Satellite altimeter and coastal tide gauge data show rising sea levels since 1870.
Before 1850: proxy records
Proxy records are sophisticated ways of inferring surface temperatures over previous centuries and millennia. Taken together, these independent records show widespread warming over the 20th century, with a particularly sharp uptick in temperature over the last few decades.
Temperature reconstructions
Surface temperature reconstructions of the past 2,000 years from proxy records show a warming trend.
While proxy records are, by definition, not as accurate or precise as direct measurements, they provide a robust picture of thousands of years of the Earth's history. Three main types of proxy records used to create this picture are:
Source: Environmental Defense Fund
As far back as the 1850s, a small number of weather stations around the world were compiling temperature records. These numbers grew during the 20th century and today there are thousands of land-based weather stations and ocean buoys in every corner of the world monitoring temperatures.
Temperature records since 1850
These temperature records clearly show a warming of the Earth over the past century, with particularly rapid heating over the past few decades.
Global temperature data
Each of the four agencies that report global temperature trends--NOAA, NASA, HADCRU, and JMA—show the warming trend.
View graph Source: NYT
Average U.S. temperatures
Annual average temperatures in the United States since 1880 also show the warming trend.
View graph. Source NASA
Satellite measurements since 1979
Atmospheric temperature measurements taken from orbiting satellites also show warming. Weather satellites have been monitoring global atmospheric temperatures since 1979.
Atmospheric temperatures
Trend in tropospheric temperatures (the lowest part of Earth's atmosphere) from 1979 to 2005 shows warming.
View graph Source: IPCC
Sea level rise in the 20th century
During the 20th century, sea level rose an average of 7 inches after 2,000 years of relatively little change.
Global sea level rise
Satellite altimeter and coastal tide gauge data show rising sea levels since 1870.
Before 1850: proxy records
Proxy records are sophisticated ways of inferring surface temperatures over previous centuries and millennia. Taken together, these independent records show widespread warming over the 20th century, with a particularly sharp uptick in temperature over the last few decades.
Temperature reconstructions
Surface temperature reconstructions of the past 2,000 years from proxy records show a warming trend.
While proxy records are, by definition, not as accurate or precise as direct measurements, they provide a robust picture of thousands of years of the Earth's history. Three main types of proxy records used to create this picture are:
- Ice cores - One proxy method is to drill into glaciers and ice sheets to extract ice samples. Since the ice was formed from snow that fell over the centuries, the deeper you drill, the farther back in time you are looking.
The chemical composition of the ice correlates very strongly with temperature. Scientists have constructed temperature records from ice cores taken from Tibetan and Andean glaciers, an ice cap in the Canadian Arctic, and the Greenland and Antarctic ice sheets. These records show that, at low latitudes, 20th century climate was unusually warm compared to the previous 2,000 years.
In the Canadian Arctic, warming over the past 150 years is unprecedented compared to the previous millennium. In Greenland and coastal Antarctica, there is clear evidence of warming over the past century. Ice cores from Antarctica's interior do not show warming over the past century. - Tree rings - In temperate regions, trees generally produce one ring a year, and some tree species are extremely long-lived. (A bristlecone pine, for example, can live more than 4,000 years.) Patterns in the width and density of tree rings provide year-by-year temperature information.
Scientists have tree ring records from more than 2,000 sites on all inhabited continents, though most of the records are from temperate areas of the Northern Hemisphere. These records show that 20th centurywarming was unusual compared to at least the past 500 years. - Coral reefs - Corals build their hard skeletons with annual bands of calcium carbonate. The geochemical composition of each annual band varies depending on the temperature of the water at the time the band was formed. Scientists have coral proxy records from the Atlantic, Indian, and Pacific oceans, with most of these going back 400 years. Coral proxy records indicate sea surface warming in most tropical locations over the past century.
Source: Environmental Defense Fund
|
|
3) How we know human activity is causing warming
We know the planet is warming — scientists have a clear understanding why
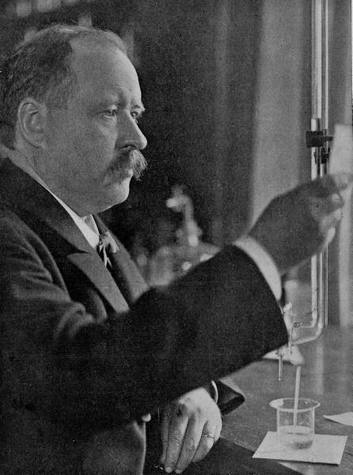
Svante Arrhenius
The theory of global warming is nothing new. The Nobel Prize-winning chemist Svante Arrhenius first proposed the idea of global warming in 1896. Carbon dioxide, he knew, traps heat in the Earth's atmosphere. He also knew that burning coal and oil releases carbon dioxide (CO2).
Arrhenius speculated that continued burning of coal and oil would increase concentrations of CO2 in the Earth's atmosphere, making the planet warmer. It's called thegreenhouse effect.
What warms the Earth?To determine what is causing today's rapid global warming, scientists have examined all the factors that can affect the Earth's temperature. There are essentially three factors that could be responsible for recent rapid global warming:
It's not the sun: cause of little warming since 1750, none since 1980sUltimately, the climate system is powered by the sun: all else being equal, if you turn up the sun, you'll warm up the Earth. According to IPCC estimates, the sun has accounted for just a small portion of warming since 1750. A study of more recent solar activity has demonstrated that since about 1985 the sun has changed in ways that, if anything, should have cooled the planet—even as global temperatures have been rising. So the sun is not causing global warming.
It's not reflectivity: changes point to cooling, not warmingAround 30% of the sun's energy that reaches the Earth is reflected back into space. Changes in how much sunlight is absorbed, and how much is reflected, can affect global temperatures. Using satellite and land-based observations and computer models, scientists have calculated how Earth's reflectivity has changed over time.
These calculations suggest that human-produced particulate pollution, especially reflective sulfur-containing particles, have had a cooling effect on the climate, masking some of the warming effect of greenhouse gases. In fact, the slight decrease in global temperature between 1945 and 1975 was likely caused by a combination of rising particulate pollution and natural factors. Warming resumed after 1975 when industrialized countries began to clean up their particulate pollution while continuing to increase their greenhouse gas emissions.
As for human land use changes (primarily forest clearing for agriculture), they have on balance brightened the planet since 1750. This would have a cooling effect, yet we've seen warming. Changes in the frequency of volcanic eruptions, which can send reflective particles up into the stratosphere, also cannot explain the observed warming trend. So reflectivity is not causing global warming.
All the evidence points to greenhouse gases
That leaves the greenhouse effect as the only remaining scientific explanation for the rise in global temperatures in recent decades. We have direct measurements of CO2concentrations in the atmosphere going back more than 50 years, and indirect measurements (from ice cores) going back hundreds of thousands of years. These measurements confirm that concentrations are rising rapidly.
Arrhenius speculated that continued burning of coal and oil would increase concentrations of CO2 in the Earth's atmosphere, making the planet warmer. It's called thegreenhouse effect.
What warms the Earth?To determine what is causing today's rapid global warming, scientists have examined all the factors that can affect the Earth's temperature. There are essentially three factors that could be responsible for recent rapid global warming:
- The sun
- Earth's reflectivity
- Greenhouse gases
It's not the sun: cause of little warming since 1750, none since 1980sUltimately, the climate system is powered by the sun: all else being equal, if you turn up the sun, you'll warm up the Earth. According to IPCC estimates, the sun has accounted for just a small portion of warming since 1750. A study of more recent solar activity has demonstrated that since about 1985 the sun has changed in ways that, if anything, should have cooled the planet—even as global temperatures have been rising. So the sun is not causing global warming.
It's not reflectivity: changes point to cooling, not warmingAround 30% of the sun's energy that reaches the Earth is reflected back into space. Changes in how much sunlight is absorbed, and how much is reflected, can affect global temperatures. Using satellite and land-based observations and computer models, scientists have calculated how Earth's reflectivity has changed over time.
These calculations suggest that human-produced particulate pollution, especially reflective sulfur-containing particles, have had a cooling effect on the climate, masking some of the warming effect of greenhouse gases. In fact, the slight decrease in global temperature between 1945 and 1975 was likely caused by a combination of rising particulate pollution and natural factors. Warming resumed after 1975 when industrialized countries began to clean up their particulate pollution while continuing to increase their greenhouse gas emissions.
As for human land use changes (primarily forest clearing for agriculture), they have on balance brightened the planet since 1750. This would have a cooling effect, yet we've seen warming. Changes in the frequency of volcanic eruptions, which can send reflective particles up into the stratosphere, also cannot explain the observed warming trend. So reflectivity is not causing global warming.
All the evidence points to greenhouse gases
That leaves the greenhouse effect as the only remaining scientific explanation for the rise in global temperatures in recent decades. We have direct measurements of CO2concentrations in the atmosphere going back more than 50 years, and indirect measurements (from ice cores) going back hundreds of thousands of years. These measurements confirm that concentrations are rising rapidly.
Historic CO2 levels
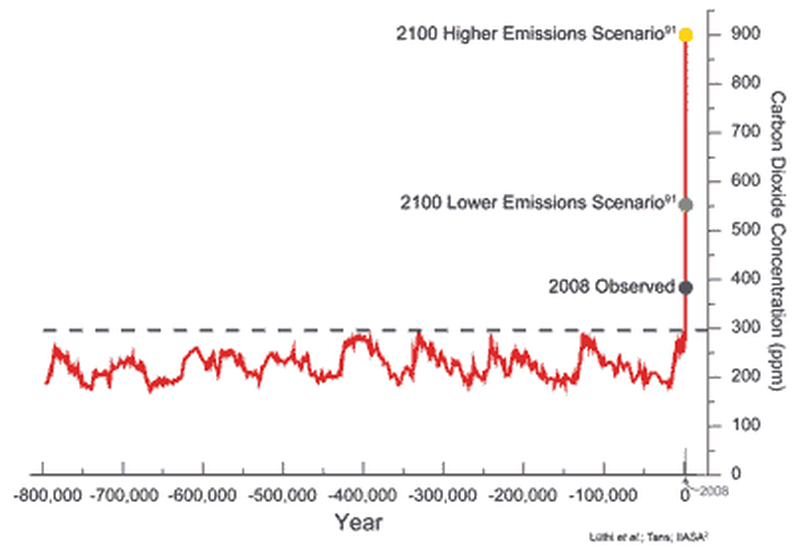
The amount of carbon dioxide in the atmosphere is higher than at any time in measurable history, and predicted to increase dramatically this century. Source: GlobalChange.gov
Though natural amounts of CO2 have varied from 180 to 300 parts per million (ppm), today's CO2 levels are around 390 ppm. That's 30% more than the highest natural levels over the past 800,000 years. Increased CO2 levels have contributed to periods of higher average temperatures throughout that long record. (Boden, Carbon Dioxide Information Analysis Center)
We also know the additional CO2 in the atmosphere comes mainly from coal and oil, because the chemical composition of the CO2 contains a unique "fingerprint."
As far as scientists are concerned, it's case closed: human activity is causing the Earth to get warmer, primarily through the burning of fossil fuels, with a smaller contribution from deforestation. All other scientific explanations for why the Earth is getting warmer have been eliminated.
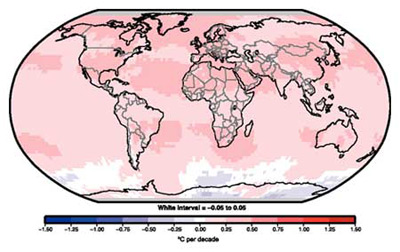
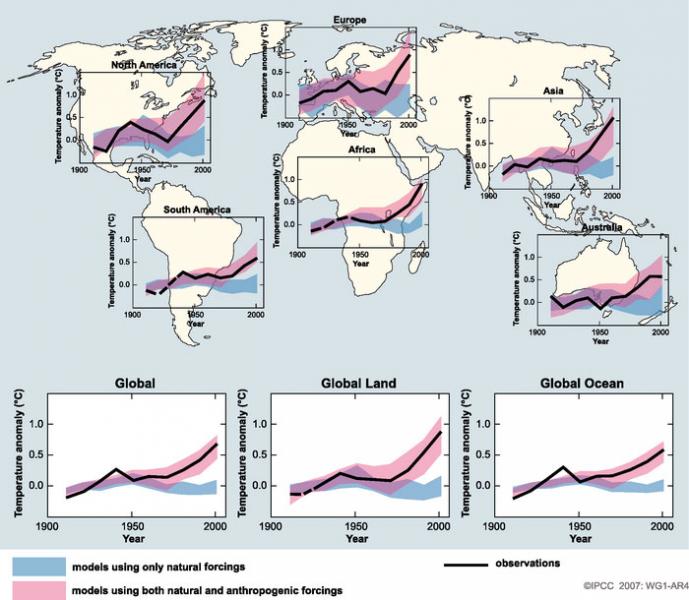
World view of human impact on temperature since 1900

Continental and global temperatures modeled with and without human influence show the impact of human activity on global warming.
View full-size. Source:IPCC 2007: WG1 AR4 Figure SPM.4
View full-size. Source:IPCC 2007: WG1 AR4 Figure SPM.4
Source: Environmental Defense Fund
4) Climate change impacts
The effects of warming on our world can be seen today
The Earth could warm another 2 to 11.5°F this century if we fail to reduce emissions from burning fossil fuels and deforestation—devastating our livelihoods and the natural world we cherish.
Impacts on the world around usBiodiversity lossThousands of species risk extinction from disappearing habitat, changing ecosystems and acidifying oceans. According to the IPCC, climate change will put some 20% to 30% of species globally at increasingly high risk of extinction, possibly by 2100.
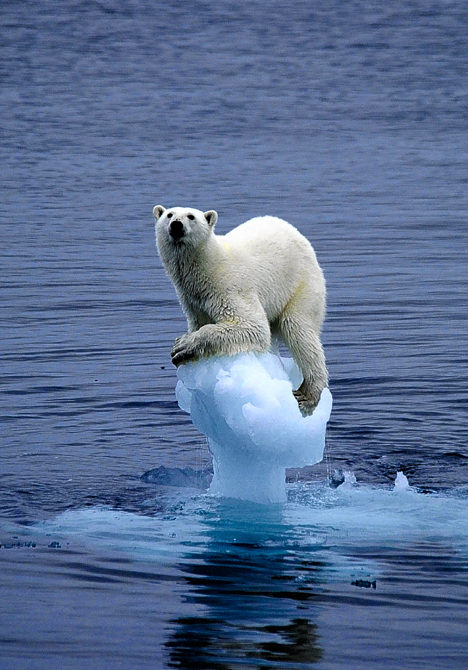
- Decline in polar bears - Arctic sea ice is the polar bear's feeding habitat. As sea ice disappears, bear mortality rises. In 2008, the polar bear became the first animal to be added to the Endangered Species Act list of threatened species because of global warming.
The U.S. Geological Survey has warned that two-thirds of the world's polar bear populations could be lost by mid-century as sea ice continues to retreat. - Acidifying oceans - About one-third of the CO2 pollution from smokestacks and tailpipes is absorbed by the world's oceans, where it forms carbonic acid. A 2010 study published in Nature Geoscience warns that unchecked greenhouse gas emissions could cause oceans to acidify at a rate unprecedented in at least the last 65 million years.
- Coral bleaching - Coral reefs are highly sensitive to small changes in water temperature. Heat triggers corals to shed the algae that nourish them—a bleaching event that leaves coral white.
In 1998, the world's coral suffered its worst year on record, which left 16% bleached or dead. (ISRS statement [PDF]) Continued warming could cause mass bleachings to become an annual event within the next few decades, wiping out many reef ecosystems. - Shifting habitat - As the mercury rises, plants and animals are shifting their ranges toward the poles and to higher altitudes, and migration patterns for animals as diverse as whales and butterflies are being disrupted.
- Threats to Western forests - The U.S. Geological Survey reports that slight changes in the climate may trigger abrupt ecosystem changes that may be irreversible.
All told, the Rocky Mountains in Canada and the U.S. have seen nearly 70,000 square miles of forest die – an area the size of Washington state – since 2000 due to outbreaks of tree-killing insects.
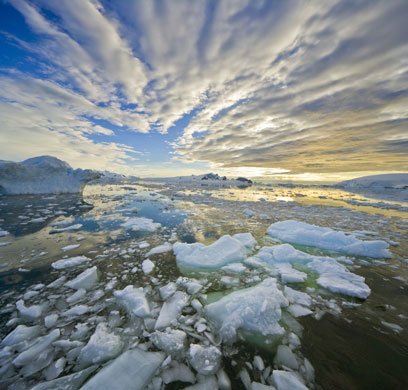
Rising seas are one of the most certain effects of global warming as warming ocean waters expand and melting glaciers, ice caps and ice sheets add more water to the oceans. The IPCC estimates that melting ice caps and glaciers—which are some of our most visible indicators of climate change—accounted for about 25% of sea level rise from 1993 to 2003.
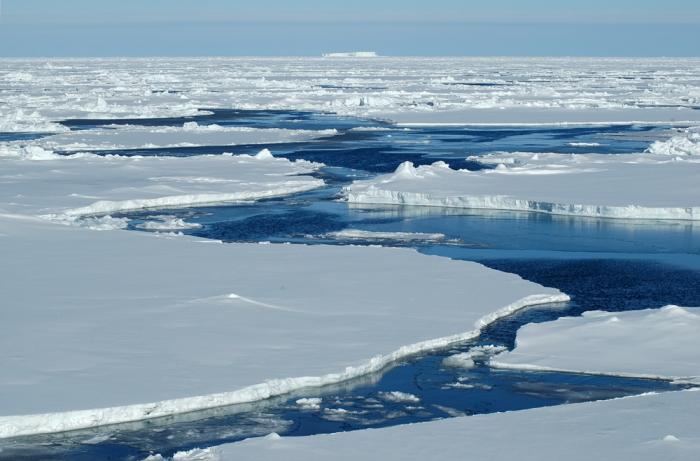
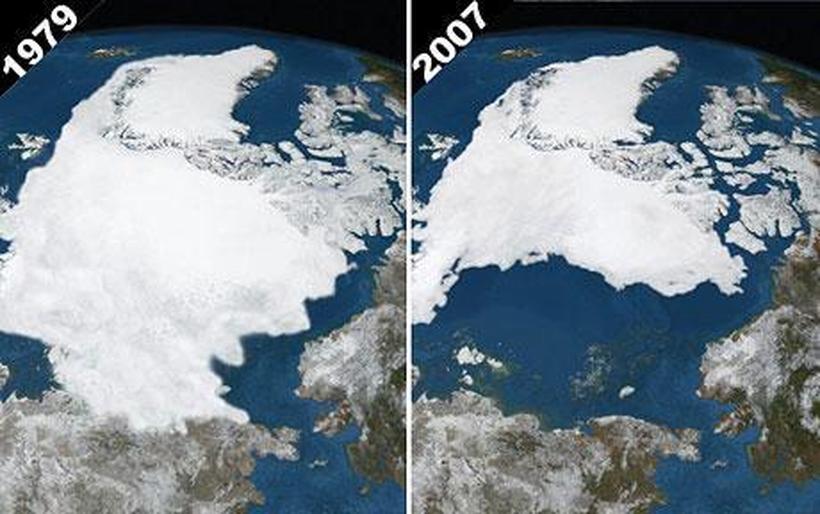
- Arctic sea ice is shrinking - Satellite images show that the extent of Arctic summer sea ice has decreased by almost 9% per decade since 1979. The Arctic summer could be ice-free by mid-century, according to a study by the National Oceanic and Atmospheric Administration.
The three lowest minimum extents of Arctic sea ice were reached in 2007, 2008 and 2010. Source: NOAAVisualizations
- Sea level rise - During the 20th century, sea level rose an average of 7 inches after 2,000 years of relatively little change. The 2007 IPCC report conservatively predicts that sea levels could rise 10 to 23 inches by 2100 if current warming patterns continue.
In the U.S., roughly 100 million people live in coastal areas within 3 feet of mean sea level. Low-lying cities such as Boston, Miami and New York are vulnerable.
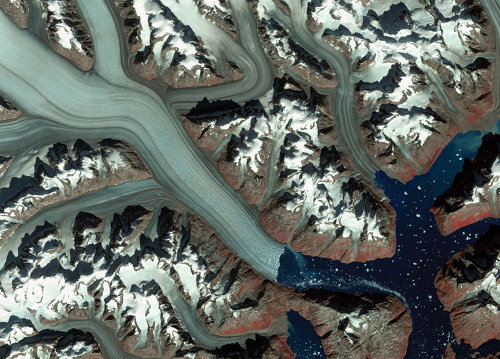
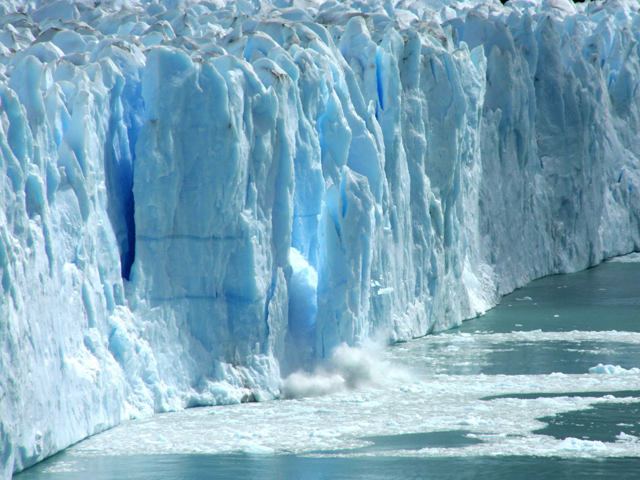
The U.S. Geological Survey, EPA and NOAA issued a joint report in 2009 warning that most mid-Atlantic coastal wetlands from New York to North Carolina will be lost with a sea level rise of 3 feet or more. North Carolina's barrier islands would be significantly breached and flooding would destroy the Florida Everglades. - Melting glaciers - A 2005 survey of 442 glaciers from the World Glacier Monitoring Service found that 90% of the world's glaciers are shrinking as the planet warms.
Glacier National Park now has only 25 glaciers, versus 150 in 1910. At the current rate of retreat, the glaciers in Glacier National Park could be gone in a matter of decades, according to some scientists.
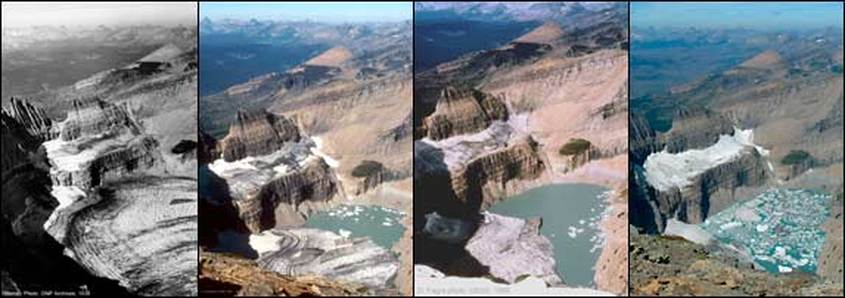
Photos from 1938, 1981, 1998 and 2009 show the disappearance of Grinnell Glacier. Credit: 1938 T.J. Hileman photo, Courtesy of GNP Archives; 1981 Carl Key photo, USGS; 1998 D. Fagre photo, USGS; 2009 Lindsey Bengtson photo, USGS. Source: USGS
Threats to people around the globe
Extreme weather will become more frequent—and more dangerous.The World Meteorological Organization reported that 2000-2009 was the hottest decade on record, with eight of the hottest 10 years having occurred since 2000.
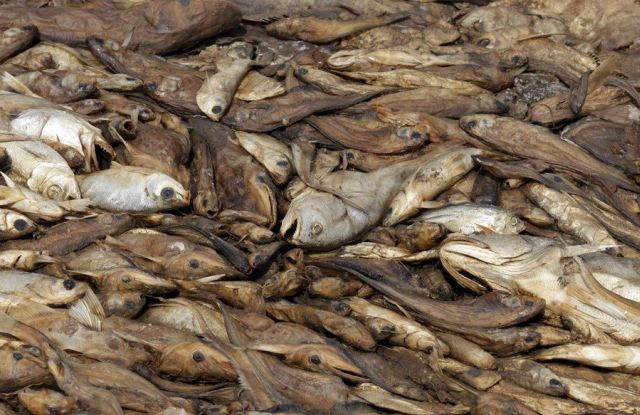
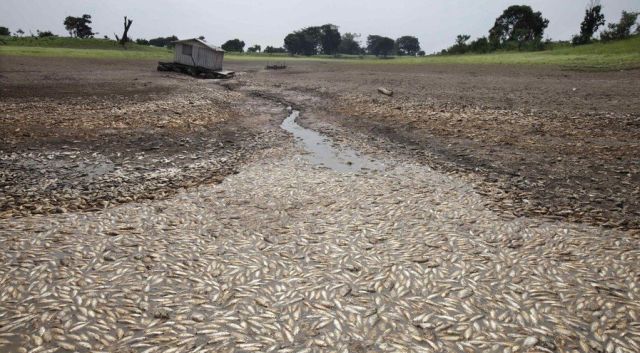
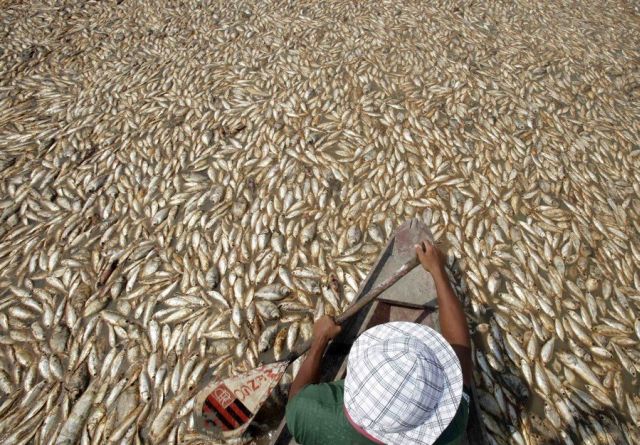
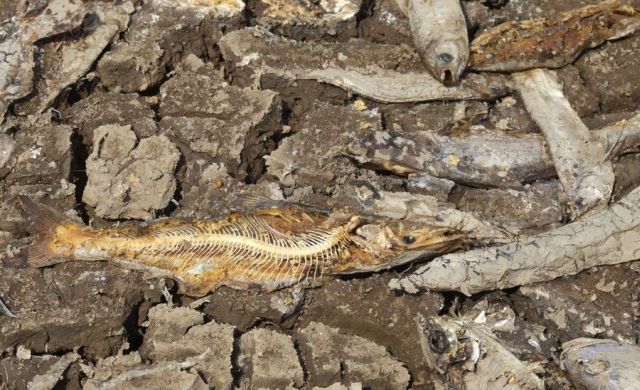
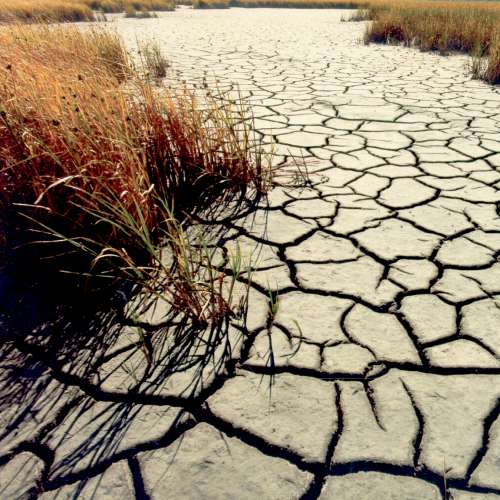
It's not just the heat that poses threats. Scientists say global warming is speeding up the cycling of water between the ocean, atmosphere and land, resulting in more intense rainfall and droughts at the same time across the globe.
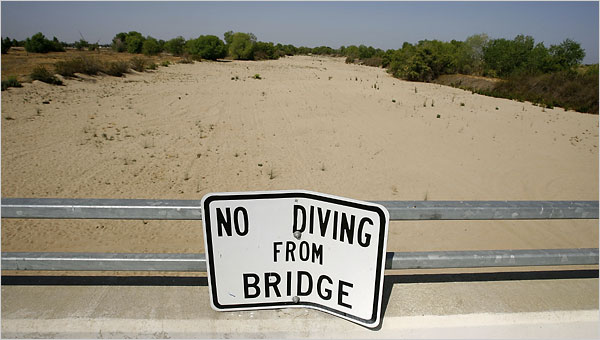
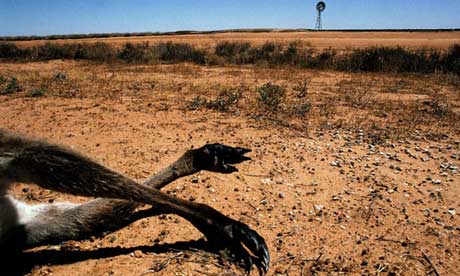
- A surge in wildfiresHot, dry conditions create a tinderbox ideal for wildfires. This could have a devastating impact on America's Southwest.
- Increased floodingThe 2007 IPCC report concludes that intense rain events have increased in frequency during the last 50 years and that human-induced global warming has been a factor.
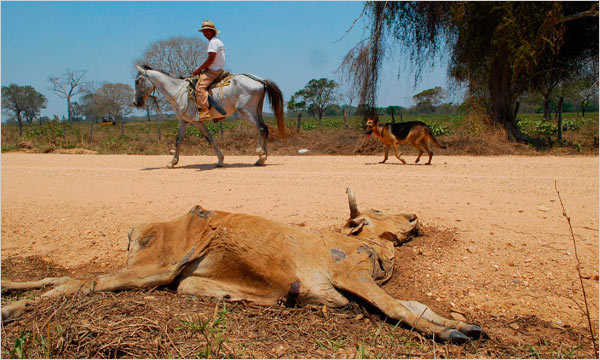
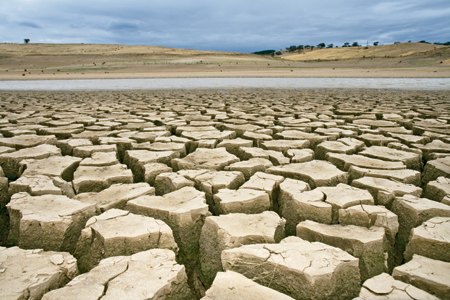
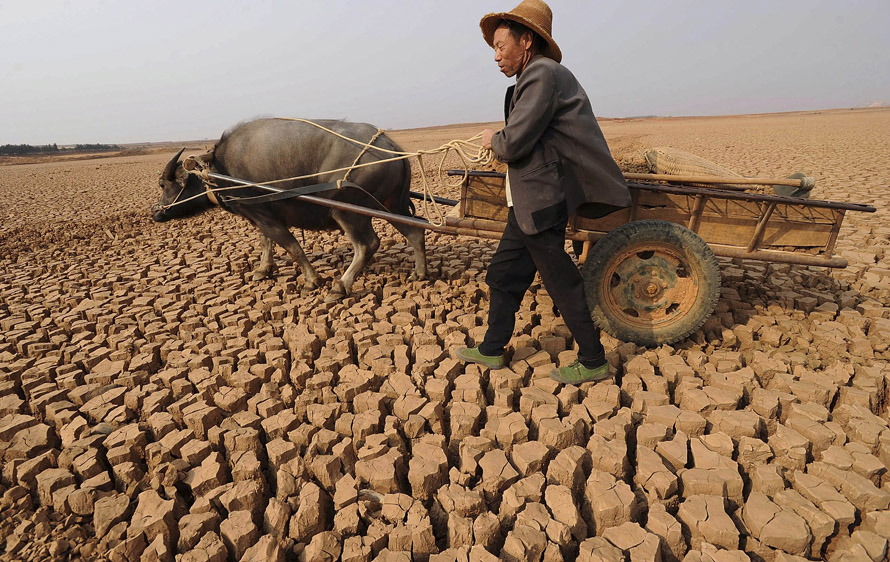
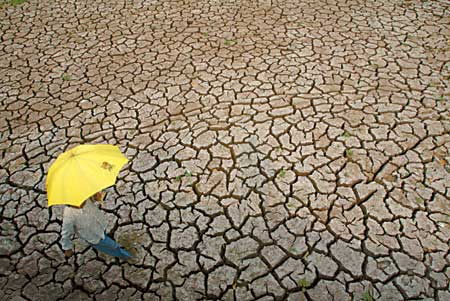
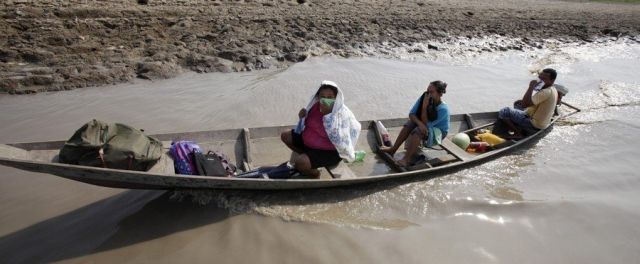
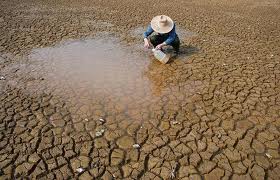
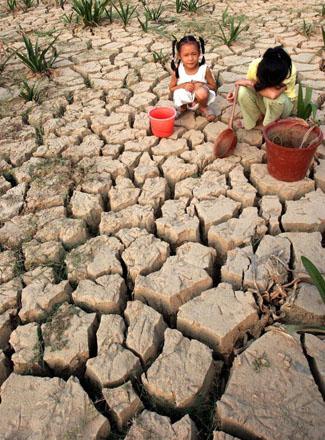
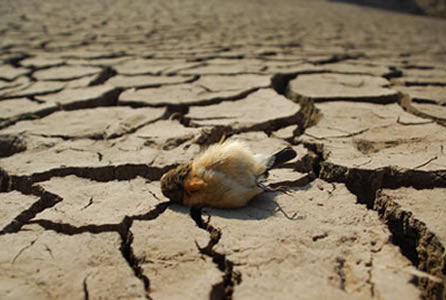
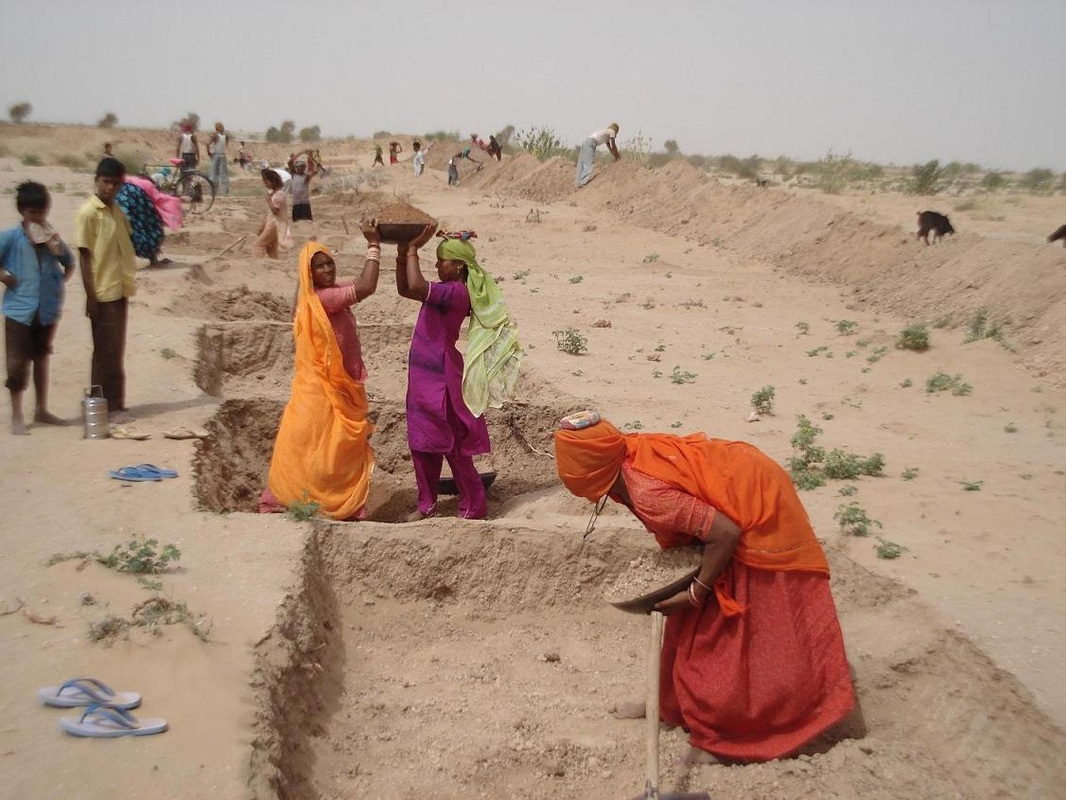
- Increased droughtThere have also been increased periods of drought, particularly in famine-stricken areas of Africa and Asia. According to the National Center for Atmospheric Research, the percentage of Earth's surface suffering drought has more than doubled since the 1970s. In Africa alone, the IPCC projects that between 75 and 250 million people will be exposed to increased water stress due to climate change.
- More intense hurricanesAs the oceans warm, scientists predict that hurricane intensity could increase. The associated storm surge poses particular risk to low-lying coastal cities like Miami, Charleston (SC) and Wilmington (NC).
A warming planet threatens people worldwide, causing deaths, spreading insect-borne diseases and exacerbating respiratory illnesses. Extreme weather will also put more people in harm's way.
The World Health Organization believes that even the modest increases in average temperature that have occurred since the 1970s are responsible for at least 150,000 extra deaths a year—a figure that will double by 2030, according to WHO's conservative estimate.
- Devastating heat waves - Recent studies show extreme heat events that now occur once every 20 years will occur about every other year in much of the country, if current trends continue.
In 1995, Chicago suffered a heat wave that killed more than 700 people. Chicagoans could experience that kind ofrelentless heat up to three times a year by 2100. - Spread of disease - Diseases such as malaria and dengue fever could become more difficult to control in areas where it's currently too cold for them to spread year-round. The malaria parasite itself is generally limited to certain areas by cooler winter temperatures since it is not able to grow below 16°C. As temperatures rise, diseases can grow and disease vectors (the carriers that transmit disease, such as mosquitoes) will mature more rapidly and have longer active seasons.
- Worsening air quality - More hot days mean ripe conditions for ground-level ozone, or smog, which forms when pollutants from tailpipes and smokestacks mix in sunny, stagnant conditions. Higher temperatures cause higher emissions of one type of pollutant, namely hydrocarbons and other volatile organic compounds, as well as speeding up the chemical reactions that form ozone smog.
Smog triggers asthma attacks and worsens other breathing problems. The number of Americans with asthma has more than doubled over the past two decades to 20 million. Continued warming will only worsen the problem.
Source: Environmental Defense Fund
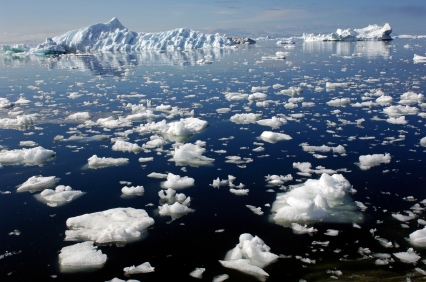
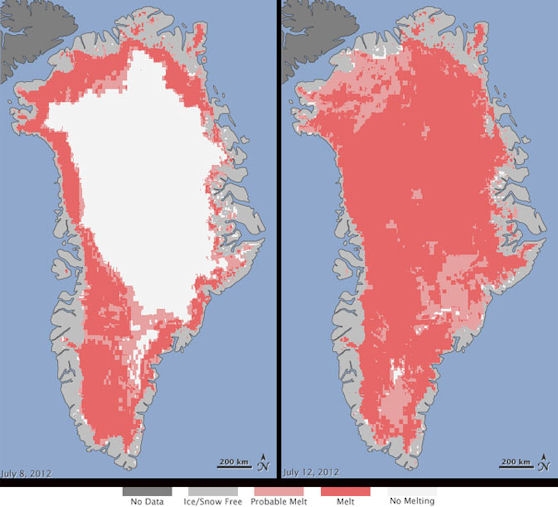
Satellites see unprecedented Greenland ice sheet surface melt
July 24, 2012: The Greenland ice sheet melted at a faster rate this month than at any other time in recorded history, with virtually the entire ice sheet showing signs of thaw.
The rapid melting over just four days was captured by three satellites. It has stunned and alarmed scientists, and deepened fears about the pace and future consequences of climate change .
In a statement posted on Nasa 's website on Tuesday, scientists admitted the satellite data was so striking they thought at first there had to be a mistake.
"This was so extraordinary that at first I questioned the result: was this real or was it due to a data error?" Son Nghiem of Nasa's jet propulsion laboratory in Pasadena said in the release.
He consulted with several colleagues, who confirmed his findings. Dorothy Hall, who studies the surface temperature of Greenland at Nasa's space flight centre in Greenbelt, Maryland, confirmed that the area experienced unusually high temperatures in mid-July, and that there was widespread melting over the surface of the ice sheet.
Climatologists Thomas Mote, at the University of Georgia, and Marco Tedesco, of the City University of New York, also confirmed the melt recorded by the satellites.
However, scientists were still coming to grips with the shocking images on Tuesday. "I think it's fair to say that this is unprecedented," Jay Zwally, a glaciologist at Nasa's Goddard Space Flight Center, told the Guardian.
The set of images released by Nasa on Tuesday show a rapid thaw between 8 July and 12 July. Within that four-day period, measurements from three satellites showed a swift expansion of the area of melting ice, from about 40% of the ice sheet surface to 97%.
Zwally, who has made almost yearly trips to the Greenland ice sheet for more than three decades, said he had never seen such a rapid melt.
About half of Greenland's surface ice sheet melts during a typical summer, but Zwally said he and other scientists had been recording an acceleration of that melting process over the last few decades. This year his team had to rebuild their camp, at Swiss Station, when the snow and ice supports melted.
He said he was most surprised to see indications in the images of melting even around the area of Summit Station, which is about two miles above sea level.
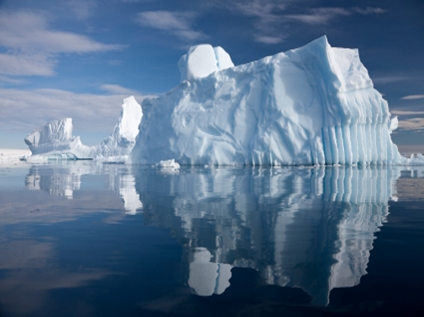
It was the second unusual event in Greenland in a matter of days, after an iceberg the size of Manhattan broke off from the Petermann Glacier. But the rapid melt was viewed as more serious.
"If you look at the 8 July image that might be the maximum extent of warming you would see in the summer," Zwally noted. "There have been periods when melting might have occurred at higher elevations briefly – maybe for a day or so – but to have it cover the whole of Greenland like this is unknown, certainly in the time of satellite records." Lora Koenig, another Goddard glaciologist, told Nasa similar rapid melting occurs about every 150 years. But she warned there were wide-ranging potential implications from this year's thaw.
"If we continue to observe melting events like this in upcoming years, it will be worrisome." she told Nasa.
The most immediate consequences are sea level rise and a further warming of the Arctic. In the centre of Greenland, the ice remains up to 3,000 metres deep. On the edges, however, the ice is much, much thinner and has been melting into the sea.
The melting ice sheet is a significant factor in sea level rise. Scientists attribute about one-fifth of the annual sea level rise, which is about 3mm every year, to the melting of the Greenland ice sheet.
In this instance of this month's extreme melting, Mote said there was evidence of a heat dome over Greenland: or an unusually strong ridge of warm air.
The dome is believed to have moved over Greenland on 8 July, lingering until 16 July.
Source
Climatologists Thomas Mote, at the University of Georgia, and Marco Tedesco, of the City University of New York, also confirmed the melt recorded by the satellites.
However, scientists were still coming to grips with the shocking images on Tuesday. "I think it's fair to say that this is unprecedented," Jay Zwally, a glaciologist at Nasa's Goddard Space Flight Center, told the Guardian.
The set of images released by Nasa on Tuesday show a rapid thaw between 8 July and 12 July. Within that four-day period, measurements from three satellites showed a swift expansion of the area of melting ice, from about 40% of the ice sheet surface to 97%.
Zwally, who has made almost yearly trips to the Greenland ice sheet for more than three decades, said he had never seen such a rapid melt.
About half of Greenland's surface ice sheet melts during a typical summer, but Zwally said he and other scientists had been recording an acceleration of that melting process over the last few decades. This year his team had to rebuild their camp, at Swiss Station, when the snow and ice supports melted.
He said he was most surprised to see indications in the images of melting even around the area of Summit Station, which is about two miles above sea level.
It was the second unusual event in Greenland in a matter of days, after an iceberg the size of Manhattan broke off from the Petermann Glacier. But the rapid melt was viewed as more serious.
"If you look at the 8 July image that might be the maximum extent of warming you would see in the summer," Zwally noted. "There have been periods when melting might have occurred at higher elevations briefly – maybe for a day or so – but to have it cover the whole of Greenland like this is unknown, certainly in the time of satellite records." Lora Koenig, another Goddard glaciologist, told Nasa similar rapid melting occurs about every 150 years. But she warned there were wide-ranging potential implications from this year's thaw.
"If we continue to observe melting events like this in upcoming years, it will be worrisome." she told Nasa.
The most immediate consequences are sea level rise and a further warming of the Arctic. In the centre of Greenland, the ice remains up to 3,000 metres deep. On the edges, however, the ice is much, much thinner and has been melting into the sea.
The melting ice sheet is a significant factor in sea level rise. Scientists attribute about one-fifth of the annual sea level rise, which is about 3mm every year, to the melting of the Greenland ice sheet.
In this instance of this month's extreme melting, Mote said there was evidence of a heat dome over Greenland: or an unusually strong ridge of warm air.
The dome is believed to have moved over Greenland on 8 July, lingering until 16 July.
Source
A word from Anthony Marr
Referring to the Huffington article [World Nearing Tipping Point For Disastrous Breakdown, Study Finds], someone asked me, "If the world is on the brink, why don't I feel it?"
The answer is three-fold:
So, enjoy the "Arctic Air Conditioner" while it lasts, and be prepared to sweat after it quits. And when it happens, believe me, you will feel the heat!
Source
Anthony Marr, founder and president
Heal Our Planet Earth (HOPE)
www.HOPE-CARE.org
www.MySpace.com/AnthonyMarr
www.YouTube.com/AnthonyMarr
www.HomoSapiensSaveYourEarth.blogspot.com
www.ARConference.org
The answer is three-fold:
- Earth's atmosphere and hydrosphere are both immense. Any cause-input will take 2-3 decades to produce the effect-output. This said, the cause-input began becoming significant as of about mid-last-century, and it has been continuous and increasing. So, in spite of the time lag, we've had measurable results, chief amongst which is the 0.9C mean global temperature rise from the baseline of 1880 when the Industrial Revolution began. Also more than obvious are the melting glaciers around the world, including those in the Himalayas, Greenland and the Antarctic, and the Arctic sea ice. Of course none of these is in anyone's backyard, so, for those with no or little awareness beyond their own physical or event horizons, "nothing is happening".
- Carbon dioxide is a stable gas and is therefore cumulative in the atmosphere to continue warming the planet for centuries to come. Even if we stopped burning fossil fuels yesterday, what we have already pumped into the atmosphere will be enough to trigger the deadly Methane Time Bomb. But, for now, nothing seems to be happening, and we carry on business as usual.
- Least known is the mechanism of latent (hidden) heat. Anyone who does not know what Latent Heat is will have a false sense of security. It is not hard to understand if I do not use physics jargon. Place on a hot stove a pot of cold water containing 1 kg of ice cubes. Stir the ice water with a long thermometer and take temperature readings. My question is: When will the thermometer begin to show a rise in temperature? Answer: After all the ice has melted. In other words, all the heat from the stove would first all go into melting the ice, without raising the water temperature. The amount of heat entering a system without raising the temperature of the system is called Latent Heat. It takes 80 calories of heat to melt one gram of ice. So in this case, the first 80,000 calories of heat from the stove went into melting the 1 kg of ice first. Only when the ice is all gone will the water temperature rise, and it will do so until it reaches 100C, when the water will begin to boil. Once again, Latent Heat comes into play, and the water temperature will stabilize at the boiling point - until all the water have changed from liquid to vapour, at which point the temperature of the dry pot will rise to the temperature of the flame itself. So how does this apply to Earth's climate? Consider the Arctic Ocean to be a gigantic pot of ice water, and the sun as the stove. For as long as there is still sea ice to melt, the Arctic Ocean will remain relatively cool, in spite of the ever increasing solar heat entering the Arctic ocean due to ever decreasing ice cover. When the sea ice is gone in the summer, as early as the latter part of this decade, the Arctic Ocean's temperature will steeply rise, and when it does, so will the global mean temperature, and all hell will break lose.
So, enjoy the "Arctic Air Conditioner" while it lasts, and be prepared to sweat after it quits. And when it happens, believe me, you will feel the heat!
Source
Anthony Marr, founder and president
Heal Our Planet Earth (HOPE)
www.HOPE-CARE.org
www.MySpace.com/AnthonyMarr
www.YouTube.com/AnthonyMarr
www.HomoSapiensSaveYourEarth.blogspot.com
www.ARConference.org
What to do:
If we all wanted to fix the global warming, it wouldn't be a problem. Trouble is, not everybody believes it is a problem.
So, if there's one thing to be done, first and foremost, it is this:
So, if there's one thing to be done, first and foremost, it is this:
CHANGE SOMEBODY'S MIND!
meanwhile...
Start
Start with personal actions - like reducing your own carbon footprint. Be a co2nscious model.
Spread the word
Try to influence your family, friends and colleagues to take action too.
Lobby
Climate change is the greatest threat facing our world today - and we are almost out of time to stop it. The world's foremost climate science body has concluded, that humankind has the technology to stop a climate catastrophe - but only with bold government action. Governments must tackle this problem now, decisively and together. And it's up to the world's people to demand that their leaders listen to the scientists.
Write to politicians, write to businesses; tell them your concerns. Click to find your elected representative in the USA, UK, Canada, Australia, and at the EU.

